Will bitcoin be harder than gold?
Bitcoin is designed as ultra-hard money
Short & clear
- Stock to Flow approach is used for
Quantification of the “hardness” of an asset. Applied to Bitcoin, there is an unusually strong correlation between Bitcoin’s market value and its ratio of inventory to a new offering.
- However, we would advise caution with forecasts based on the model. Even the best statistical model can fail miserably in predicting the future. A major challenge for the stock-flow model is the next halving of Bitcoin’s supply growth next year.
- Nevertheless, the Stock to Flow approach serves as a good heuristic for understanding Bitcoin. So it becomes clear: Bitcoin is designed as ultra-hard money. Next year it will already have a similar degree of hardness to gold. In the year 2024 (when another halving is due) the degree of hardness will again increase massively.
- While gold had to “work hard” to achieve its high stock to flow value over thousands of years, Bitcoin’s purely digital character enables “offer engineering”, which rapidly increases the stock to flow value.
Gold has a high stock to flow ratio,

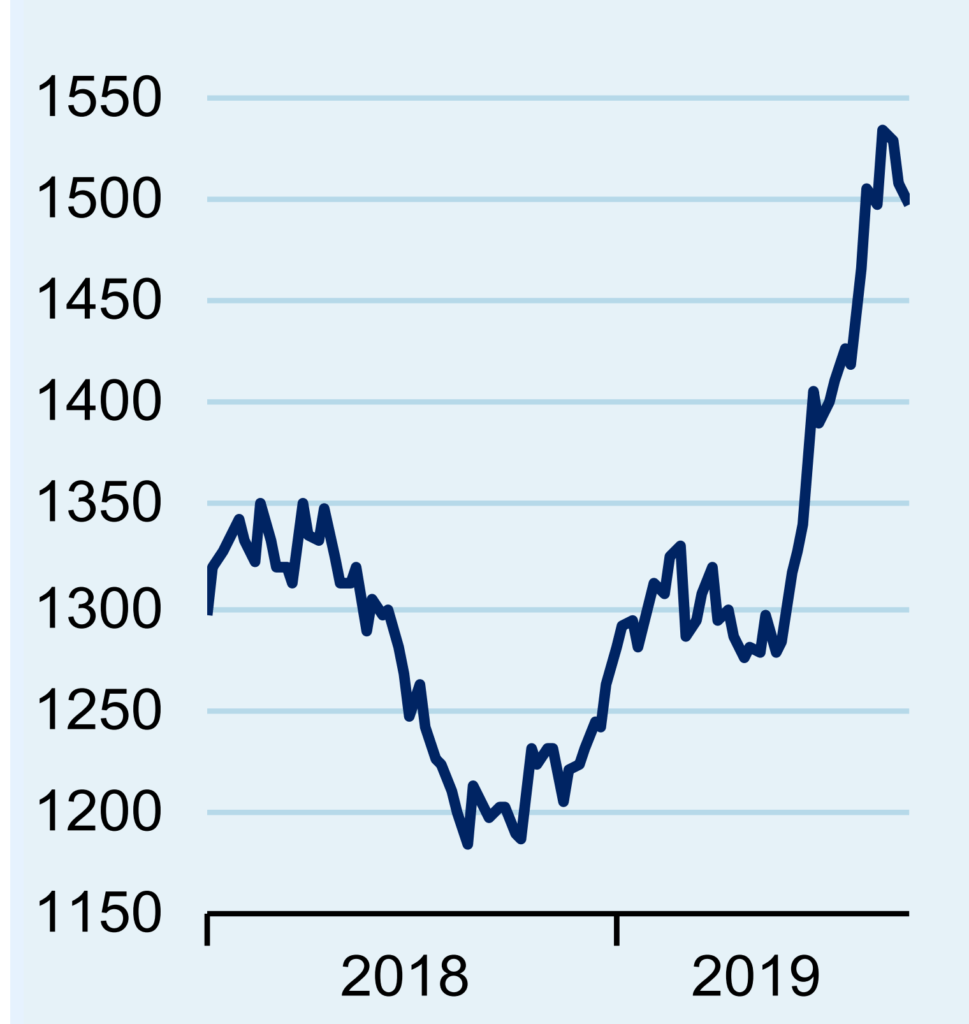
Further extensive easing steps by central banks are to be expected worldwide and ever-larger parts of the bond spectrum (currently almost USD 15 trillion) are showing a negative yield. Not surprisingly, this gives a boost to the oldest store of value in human history. At the beginning of September, the price of gold climbed (albeit temporarily) to USD 1,550 (chart). The attractiveness of gold is known to be that its supply cannot be expanded at will and that the limited annual growth (flow) in new gold meets an already very large stock. Consequently, gold has a high stock to flow ratio, which can be seen as a quantification of the “hardness” of an asset. Thus, gold does not have the so-called “easy money” trap, where a price increase leads to noticeably higher production, which dilutes the existing stock to such an extent that a downward price spiral is initiated.
The Silver Trap:
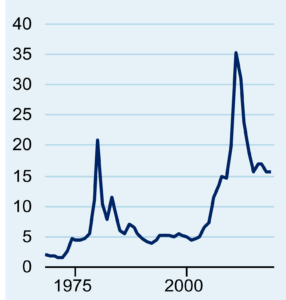
The Hunt brothers fell into the "Easy Money" trap around 1980. They tried, they hoped that by buying up silver they could push the price so far that it would be used again as a monetary good. This plan initially paid off and speculators noticeably boosted prices. However, production adjusted to the new price and the significantly higher supply caused the price to plummet again (chart).

The stock to flow ratio also serves as a quality criterion for monetary goods. Historically, the commodity with the highest stock to flow ratio has always been used as money, as it allowed the best value transfer over time. Here, it is not the limited stock of an asset that plays the dominant role, but the ratio of stock to current “production”. In absolute terms, the stock of palladium, for example, is much smaller than that of gold (only 5% of the gold stock). However, this does not make palladium a harder asset, as the new supply of palladium (flow) is relatively high and can easily dilute the stock if prices rise (“easy money” trap). Many precious metals such as palladium, which are mainly used as industrial metals, therefore have a low stock to flow ratio, i.e. the production of one year roughly corresponds to the initial stock in that year.
At this point, it also becomes clear that it is advantageous for a monetary good if it can be used too little other than money (exchange and storage of value). Only then can a high inventory pile up and hold up over time.
Stock-to-Flow approach found its way into Bitcoin’s economic analysis
With the book by Saifedean Ammous (“The Bitcoin Standard”), the stock to flow approach – derived from raw material analysis – was also applied in the analysis of Bitcoin. This corresponds to the basic idea of Bitcoin, which was explicitly designed as a new monetary commodity and is based on the precious metal money forms. This means that new Bitcoin cannot be mined at will. At the same time, Bitcoin is purely digital and is therefore often referred to as “digital gold”.
The stock to flow approach provides a simple quantitative framework for analyzing the (price) development of Bitcoin, which has a high explanatory value and makes Bitcoin comparable to gold and co. In particular, the continuation of Bitcoin’s stock to flow ratio into the future provides interesting insights: As early as next year, Bitcoin will have a stock to flow value similar to that of gold. How is this possible?
“Unfair” offer engineering at Bitcoin
Since Bitcoin is digital, the offer path could initially be defined arbitrarily in the protocol. One could say that Satoshi “cheated” in the whitepaper because he pretended such a drastic and jerky decline in offer growth (halved every 4 years) that no physical element in the periodic table could keep up. Satoshi’s “stroke of genius” was to decouple the offer from the price and the digging effort (in the case of Bitcoin, the computing power). This “Difficulty Adjustment” was missing with all Bitcoin predecessors like e.g. Bit Gold. Thus (on average) every 10 minutes new Bitcoins (currently still 12.5) are issued. If the price rises (falls) and more (less) computing power comes into the system, the degree of difficulty for digging new bitcoins is adjusted accordingly upwards (downwards).
This ensures the desired output of Bitcoins regardless of price fluctuations. Another special feature of the Bitcoin token, which also originates from its digital character, is that it cannot be hung around your neck (like a gold chain, for example) or used as input material. What seems to be a disadvantage, at first sight, is a feature and not a bug from the point of view of the stock to flow approach. Since there is no other use for Bitcoins, no other demand developments (e.g. gold demand in the course of smartphone distribution) can distort the price. deterministic supply development also eliminates supply shocks
Goldrush in Canada:
From 1896 onwards, a total of around 100,000 gold prospectors flocked to the Klondike River near Dawson. Motivated by the pursuit of material prosperity and high unemployment in the USA, many adventurers made their way to the northwest of Canada. The gold rush lasted until 1899 and increased gold supply on the world market sufficiently to temporarily cause the price of gold to fall.
Gold had to “work hard” to achieve its high stock to flow value over thousands of years. There were no shortcuts for gold. A higher stock could only have piled up in a shorter time if it had been easier to mine gold. But then gold would not have come into question as a store of value, whereupon no one would have held the yellow metal. Only through the high production costs, a lot of time and probably also through a First Mover Advantage (there were natural deposits of gold so that it was available very early as a monetary commodity) was gold able to be mined, at least for about
30 years from the mid-1880s until the beginning of the First World War.
Due to the “supply engineering”, Bitcoin should succeed in achieving a stock to flow value similar to that of gold today as early as next year – i.e. within only 11 years. The supply profile defined by Satoshi is guaranteed by a global peer-to-peer network and the centripetal forces of such a large network: it is virtually impossible to persuade the entire network to create a new supply profile (i.e. software protocol), especially since in the case of an inflationary profile this would be countered by the incentives of the individual node operators (this would dilute the value of their Bitcoin).
The strong correlation between value and Bitcoin’s stock to flow ratio
To show that the market value of Bitcoin can be explained by a stock-to-flow model, we have econometrically estimated this relationship (inspired by this article). The Bitcoin blockchain itself provides the data for the stock and the additional offer of Bitcoin (after all, this is a public database). The number of blocks is sufficient since the number of Bitcoin per block is known. We also need price data for our dependent variable (market value). These data are also available due to the establishment of Bitcoin exchanges in mid-2010.
To check the plausibility of the estimate results, we also deduct the market capitalizations and stock to flow ratios of gold, silver, platinum, and palladium. The sources here are the classical publications in which stocks and production quantities are reported. In particular, we are faced with the question of which is the appropriate number for the respective production. In order to keep the data acquisition process simple, we consider only mine production as production, i.e. the process that transports the raw material “over the earth”, i.e. adds new raw material to the economic cycle.
Bitcoin is gold close on its heels

A problem with Bitcoin’s inventory data is “lost coins” (more precisely, lost private keys), since nobody knows how many there are. We have assumed one million (the never moved coins of Satoshi himself). The uncertainty about the actual stock of precious metals naturally also exists.
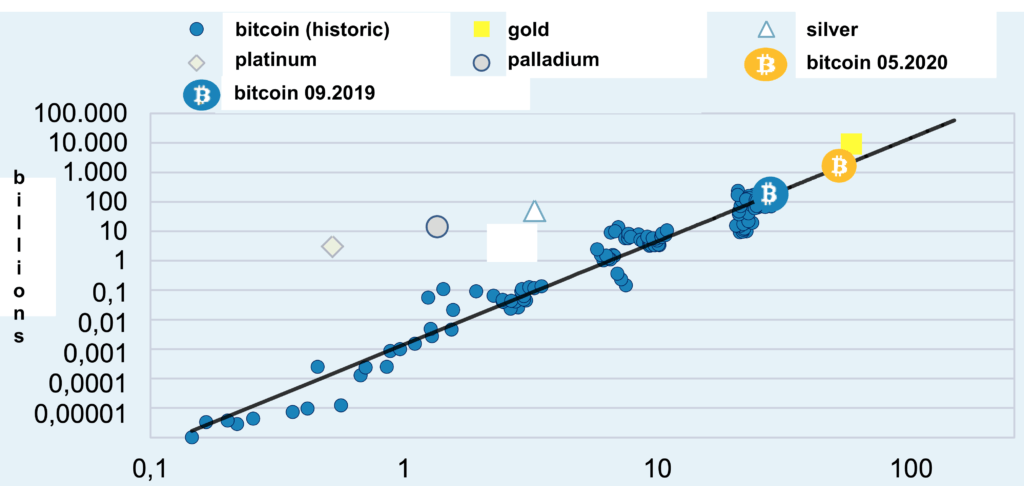
A linear regression of the (logarithmic) data provides us with the relationship shown in the graph above: Bitcoin’s market value rises linearly with increasing stock to flow value. So the higher the degree of hardness of Bitcoin, the more value is attributed to it. The (blue) points close to the regression line already show that there is a very close correlation. Test statistics also confirm this. For all those interested in econometrics it should be said that this is not a “Spurious Regression” where the test statistics are unreliable.
The reason: The variables are co-integrated, i.e. they follow a common stochastic trend. Following the well-known explanation of cointegration with the drunk and his dog (link to paper): Put simply, the stock to flow value is the road on which a drunk (the market value of Bitcoin) staggers back and forth without ever leaving the roadblocks.
If you take a closer look at the graph, you will notice that platinum, palladium, and silver are all well above the regression line. This suggests that their market values are primarily or at least strongly based on their utility values (as industrial metals) and that their monetary premiums are low. Gold, on the other hand, is quite close to the regression line, which is only logical: here it is exactly the other way round: high demand as a store of value, but low industrial demand.
The most exciting thing, of course, is looking to the future. Bitcoin’s stock to flow value will increase drastically in May 2020, i.e. after the next halving: From currently approx. 25.8 to almost 53. Gold’s stock to flow value of currently around 58, on the other hand, will be only marginally higher in May 2020, if at all. If you feed this May value for Bitcoin’s stock to flow into the model, the result will be a vertiginous price of around USD 90,000 per Bitcoin. Accordingly, in the current price of around USD 8,000, the pending halving effect would hardly be priced in (the current model value is around USD 7,500).
Conclusion: Bitcoin has been designed to be even harder than gold.
As a forecaster, one knows only too well that even the best statistical model can fail miserably in predicting the future. The big test for the Stock Flow model is certainly the halving next year. Until then, the stock to flow approach serves as a good heuristic for the understanding of Bitcoin. So it becomes clear: Bitcoin is designed as ultra-hard money. In the year 2024 (when another halving is due) the degree of hardness increases mercilessly to a level never seen before in human history (stock to flow over 100!). Nobody really knows what effects such a monetary standard would have. What is clear is that if Bitcoin were to become the money of the 21st century, it would be because its properties (especially its high degree of hardness) were preferred to those of alternative forms of money – because Bitcoin is a completely open and voluntary money system.
- Bitcoin is designed as ultra-hard money
- Short & clear
- Stock-to-Flow approach found its way into Bitcoin’s economic analysis
- “Unfair” offer engineering at Bitcoin
- The strong correlation between value and Bitcoin’s stock to flow ratio
- Bitcoin is gold close on its heels
- Conclusion: Bitcoin has been designed to be even harder than gold.
Disclaimer
This publication is merely a non-binding statement on market conditions and the investment instruments mentioned at the time of publication of this information on 01.10.2019. In our opinion, this publication is based on generally accessible sources that are considered reliable and accurate, but we cannot assume any liability for the completeness and correctness of the sources used. This research report is a purely economic analysis and no part of it should be construed as a securities analysis or recommendation. In particular, the information on which this publication is based has neither been checked for accuracy nor for completeness (and timeliness). Therefore, we cannot assume any liability for the accuracy and completeness of the information. Furthermore, this publication is for general information purposes only and in no way replaces personal investor and property-related information.

